

YOUR POWERHOUSE FOR DIGITAL MARKETING SOLUTIONS (JUNE)
CONTENTS

How We Watch Video
The 9.6% in May 22 listed as Other is now broken out in May 23 to 5.8% in Other plus 1.3% Tubi. 1.1% Roku and .9% Pluto- showing a slight drop to 9.1% – these are the free channels and where most ads are shown.
Youtube TV jumps 1.8% making it the strongest single point delivery source in Streaming.
When you combine YouTube TV and Other you have 17.6% of all viewership but 48.3% of all streaming.
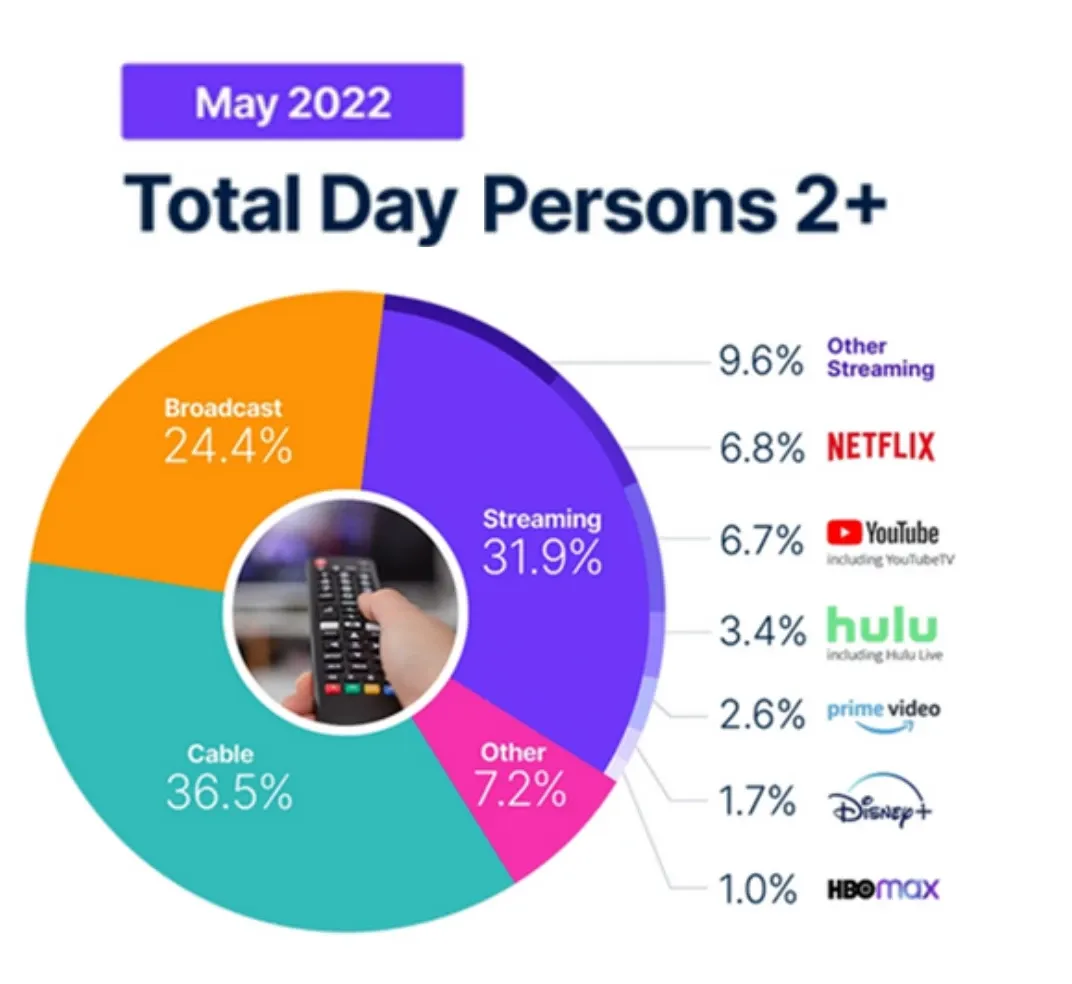
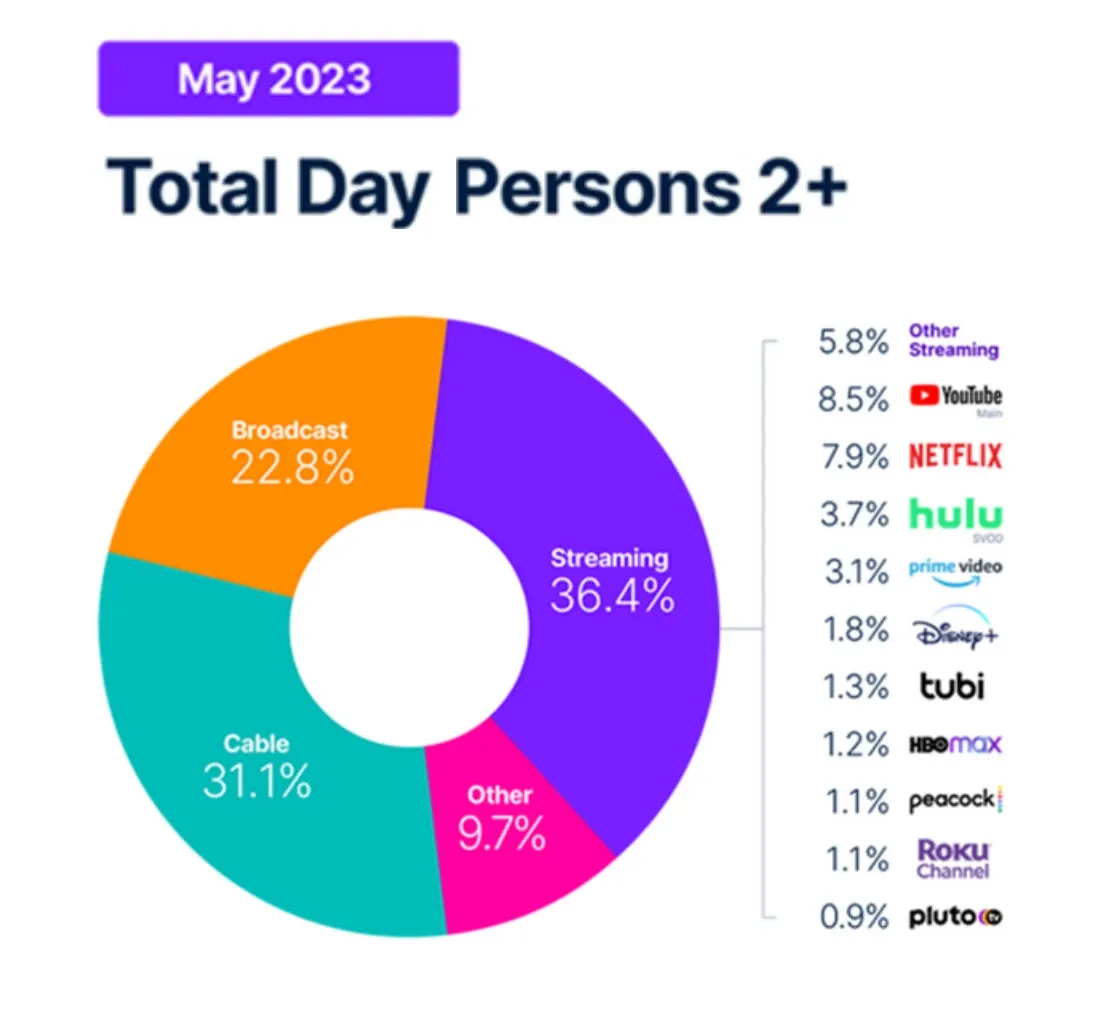
In a single Year
- Broadcast TV slips—1.6% points or 6% of its viewers
- Cable slips—5.4% points or 14.8% of its viewers
- Streaming gains—4.5% points or 14.1% in viewers
- Other (YouTube/TikTok)—gains 2.5% or 34%
Roku joins the 1% club
5 big questions re: how we watch video:
1) How much time do we spend online?
2) What share of our online time is spent with video?
3) Which streaming apps account for the highest share of total TV?
4) Do men or women spend more time streaming TV?
5) What share of the population watches streaming content daily?
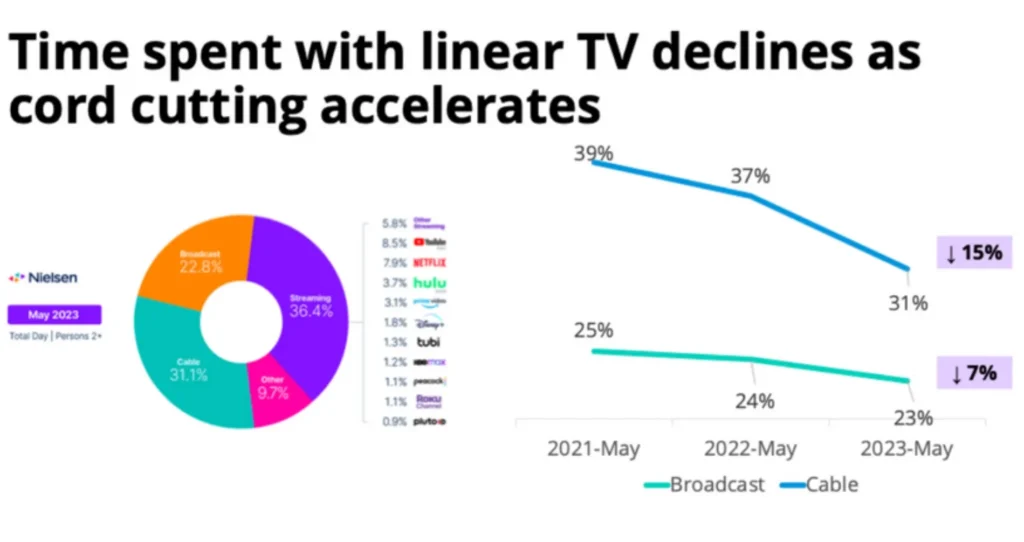
2) Cable – 31%
3) Broadcast – 23%
4) Other – 10%
Big question #1:
How much time do we spend online?
Quick answer: 7.5 hours per day
Share of time spent online by device according to eMarketer:
1) Mobile – 51%
2) CTV – 25%
3) Desktop/Laptop – 15%
4) Other – 9%